Formative Assessment 4


Quiz Summary
0 of 1 Questions completed
Questions:
Information
You have already completed the quiz before. Hence you can not start it again.
Quiz is loading…
You must sign in or sign up to start the quiz.
You must first complete the following:
Results
Results
0 of 1 Questions answered correctly
Your time:
Time has elapsed
You have reached 0 of 0 point(s), (0)
Earned Point(s): 0 of 0, (0)
0 Essay(s) Pending (Possible Point(s): 0)
Categories
- Not categorized 0%
- 1
- Current
- Review
- Answered
- Correct
- Incorrect
-
Question 1 of 1
1. Question
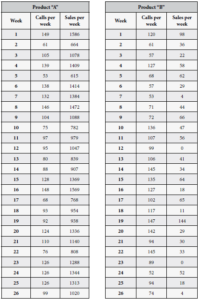
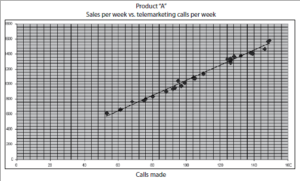
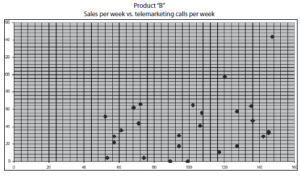
In the tables above, there are records of telemarketing calls for two different products, together with the sales figures for the products being marketed. Product “A” is already plotted as an example. Plot the points for Product “B” on the blank graph paper supplied overleaf and see what conclusions you can arrive at for both. What do you think management should do with this information?
-
Upload your answer to this question.
This response will be reviewed and graded after submission.
Grading can be reviewed and adjusted.Grading can be reviewed and adjusted. -