Formative Assessment 7: SO2 AC4 EEK4 US 252036
Quiz Summary
0 of 1 Questions completed
Questions:
Information
You have already completed the quiz before. Hence you can not start it again.
Quiz is loading…
You must sign in or sign up to start the quiz.
You must first complete the following:
Results
Results
0 of 1 Questions answered correctly
Your time:
Time has elapsed
You have reached 0 of 0 point(s), (0)
Earned Point(s): 0 of 0, (0)
0 Essay(s) Pending (Possible Point(s): 0)
Categories
- Not categorized 0%
- 1
- Current
- Review
- Answered
- Correct
- Incorrect
-
Question 1 of 1
1. Question
Represent Data and Calculations in a Graphical Format
Individually as per your facilitator’s instructions, complete the following:
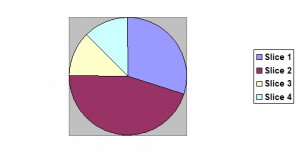
7.1 Draw a reasonably accurate pie chart by hand based on the following data:
- Absenteeism due to transport problems 108º
- Absenteeism due to illness 162º
- Absenteeism due to training 45º
- Absenteeism due to family commitments 45º
Give your chart a title that accurately reflects the kind of data represented;
Title:
- Legend:
7.2 The following table shows the average rainfall recorded in Putsonderwater in summer 2009 – 2010.
Oct
Nov
Dec
Jan
Feb
March
April
25 ml
10ml
70ml
60ml
50ml
45ml
20ml
a) Draw a bar graph to illustrate the rainfall pattern
b) What is the average/mean?
c) What is the median?
7.3 Complete the following in small groups:
Human development indicators for different provinces, 1991
Province
Life expectancy
Western Cape
67,7
Gauteng
66,0
Northern Cape
62,7
Mpumalanga
62,4
Free State
61,9
Kwazulu-Natal
61,6
North West
59,7
Eastern Cape
60,7
Limpopo
62,7
a) Draw a graph to illustrate life expectancies in the different provinces
b) Analyse the graph and in your own words, explain what it depicts
7.4 Give examples of the type of data in the workplace that you would represent with
a) a bar chart,
b) a line chart and
c) a scatter diagram:
-
This response will be reviewed and graded after submission.
Grading can be reviewed and adjusted.Grading can be reviewed and adjusted.